Air pollution – Chapter 1
So here we are in Auvergne, with crystal clear blue skies, topping the list of air pollution-free regions. Or are we? In other words, how blue is blue?
Numbers should tell really.
So let’s look at … China for instance – It is a random choice, without any hidden agenda, you have my word for it.
Air pollution happens to be extensively tracked in China and reported on www.aqicn.org. The mapping is impressive. When I was in Suzhou I used to check the reading every morning before going to work – “Mask” had been added to the morning to-wear-or-not-to-wear checklist. 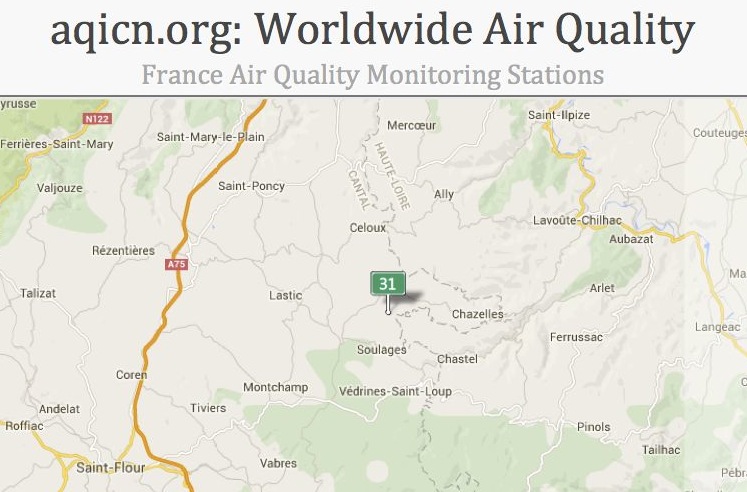
You may think it would be so convenient to have this kind of transparent information anywhere in the world.
What about Paris? Well, yes, vow fulfilled. Paris is extensively covered by the aqicn website.
What about Auvergne then? Well, I am telling you, this is luck beyond belief. The aqicn website reports air pollution levels of Rageade, a 100-inhabitant village on the opposite hill across the valley just 5 kilometres away from the farm.
This is absolutely unreal. I can now check online whether I have to wear a mask before going out to my garden.
So, how blue is blue? Easy, you may think: just compare the readings, let’s say for Beijing and Rageade, at any given time.
This is where things start getting tricky. Go and get yourself a candy bar before we proceed.
Beijing records 6 air contaminants readings, whereas Rageade only records 2: PM10 and O3. Fortunately, those are also recorded by Beijing. Or so it seems.
Let’s forget about O3, on grounds of ignorance, and let us consider PM10, referring to air pollution by particles less than 10 microns in diameter. On both pages, PM10 is said to be reported according to the US EPA AQI Standard. So far so good.
I carried out some investigation on 19 December 2015 (take note of the different time zones): 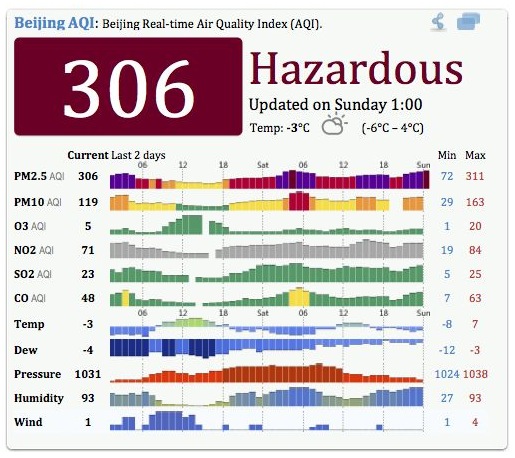
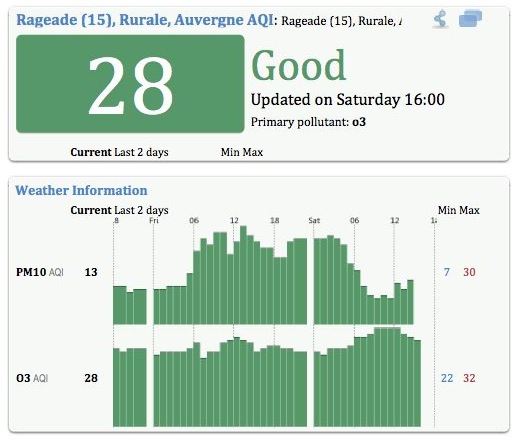
Over the previous 2 days, PM10 had peaked at 163 in Beijing and 30 in Rageade.
But wait a minute. Beijing also shows a PM2.5 index, referring to air pollution by particles less than 2.5 microns in diameter, whereas Rageade does not. Does it make any difference? Well, yes it actually does. Very much so.
We are having a short break here, before the headache starts. Go for a quick cup of coffee and don’t forget to wash your cup before you come back.
For it turns out that PM10 in the Beijing report actually refers to air pollution by particles between 2.5 and 10 microns in diameter. Hence, it does not account for those below 2.5 microns in diameter, whereas it does in the Rageade report – The latter does not actually follow the US EPA AQI Standard (see below).
And when you look at the Beijing PM2.5 index reading 306, you may think it is a hell of a lot of particles.
But how would you know? PM2.5 is an index, not a physical value. To make some sense of it, you would have to convert it into some sort of comprehensible data, such as a concentration expressed in weight per unit of volume, for instance micrograms per cubic metre (μg / m3).
Please don’t go away now. No, you don’t need to get a slide ruler. Keep calm and remain seated. The airnow.gov website provides such a conversion tool: the AQI calculator. Magic.
And yes, I have checked, their definition of PM2.5 and PM10 is consistent with the reporting standard.
So let our common sense assume that PM2.5 and PM10 peaked at roughly the same time on 19 December 2015 in Beijing, which the recording chart confirms, and let’s consider 300 and 150 as their concurrent reading at some point.
According to the AQI calculator:
– a PM2.5 reading of 300 is equivalent to a concentration of 250 μg / m3,
– a PM10 reading of 150 is equivalent to a concentration of 254 μg / m3.
Hence, altogether the guys in Beijing were sadly breathing around 500 μg / m3 of particles on 19 December 2015.
Back to Rageade, we are then just a conversion away from being able to assess the blueness of our skies.
But hold on. The reading in Rageade is actually provided by our local friends from ATMO Auvergne, and is probably automatically downloaded to aqicn. And guess what? ATMO reports its PM10 measurements directly in μg / m3 … and not according to the US EPA AQI Standard.
So, basically, on 19 December 2015, the sky in Rageade was 500:30, that is 17 times bluer than in Beijing. Merry Christmas.